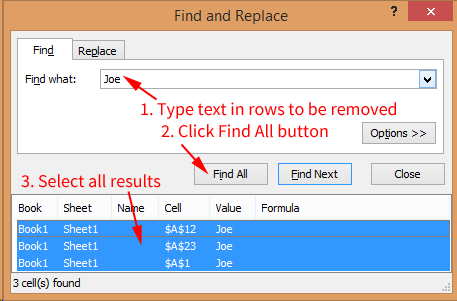
Recently I had some data from a website that was poorly formatted, but I needed to get it into a spreadsheet to work with. When I copied the data into the spreadsheet, I needed to remove all of the rows that contained certain irrelevant data, such as repeated header fields. Other use cases might require you to delete any rows containing someone's name, a location, or some … [Read more...]
Using Userform and VBA to get Dynamic Data Validation
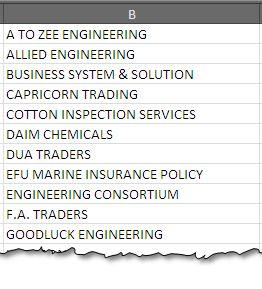
Lists are one the commonly used features of Excel. We use them to choose amongst the already selected choices and to avoid repetitive typing. One of the methods to do this is to use Dropdown menu from the Data Validation Option under Data Tab. Though this is realistic and practical option it lacks one feature that I really need – auto completion. If it has been present to … [Read more...]
Creating a Waterfall Chart in Excel 2010
Water fall chart shows the cumulative effect of a quantity over time. It shows the addition and subtraction in a basic value over period of time and the final effect of these transactions. In Excel 2016, the chart is available by default and can be easily added through Insert>Chart>Other Charts>Waterfall. In today’s post, we will learn how to produce similar chart … [Read more...]
How to Use Excel to Keep Track of Personal Finances
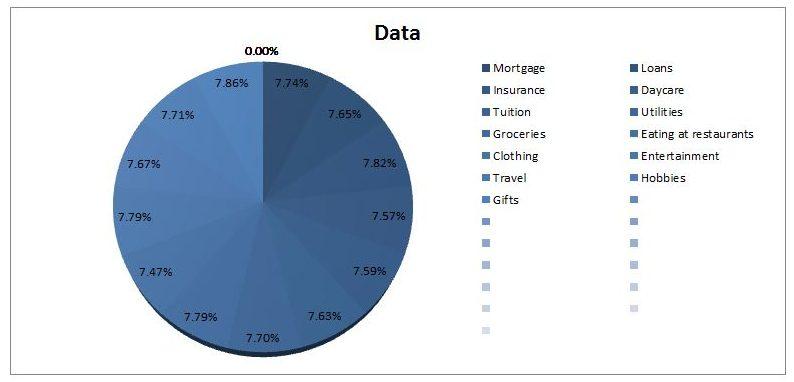
Keeping track of your personal finances can be a very painful exercise and prove very difficult to stay on top of. There are a number of online tools available to help in this regard but, more often than not, they aren't tailored to your financial profile or objectives. Using Excel to do this allows for simple customization to your needs without sacrificing the powerful … [Read more...]
How to Create Combination Charts in Excel
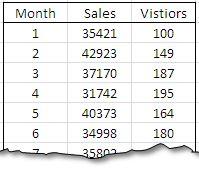
Most Excel users know how to create either a bar chart or a line chart to visually show a set of data. One way to really step up your game and graphically show multiple relationships across two or more sets of data is to use a combination chart. This powerful function will allow you to combine a bar chart and a line graph and add a Y-axis (vertical line) to express broader … [Read more...]