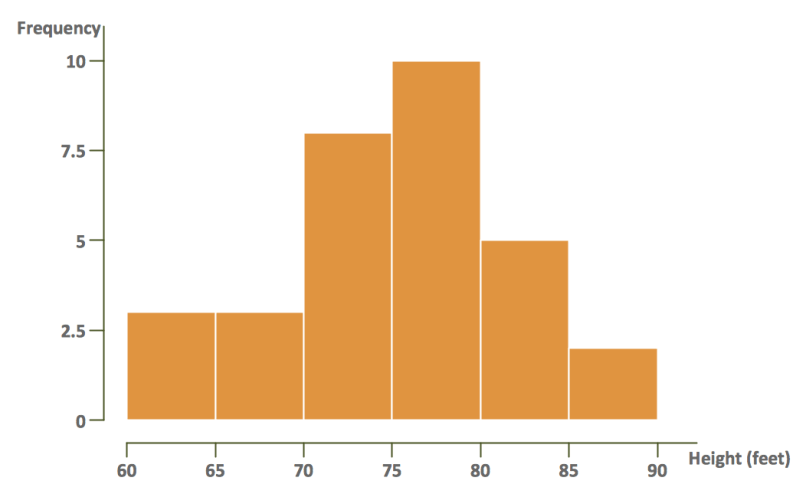
Introduction: The data analysts start their analysis by visual examination of the data. This is to see if there are any patterns present or if there is any (apparent) relationship between variables. The data such plotted produced graphs of various types - an Excel Histogram is just one of them. In today’s tutorial, we will learn a little but of theory about histogram, how … [Read more...]
5 Must-Have Excel Skills for Accountants
Accountants are part of every organization, and they are important because they manage the monetary aspects of the business. They must be able to work with different types of people and across various departments. Therefore, they must use various tools, one of which is MS Excel. In order to use it productively, they must have the necessary skills and know when to apply … [Read more...]
7 Things CPA Should know about VBA Macros
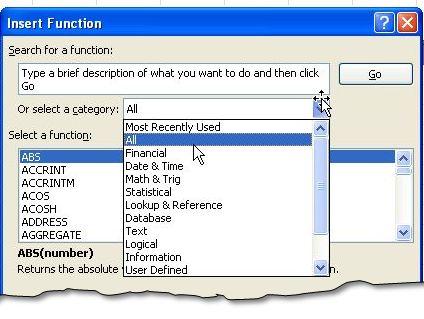
VBA stands for visual basic for application. It is the default programming language for MS Office. If you want to program MS Excel you should know how to work with VBA Macros. VBA is at the same time is fun and a source of improving productivity. Actually it provides an opportunity to do things what canot be done in usual way or to have features that are not available by … [Read more...]
Remove All Rows Containing Certain Data
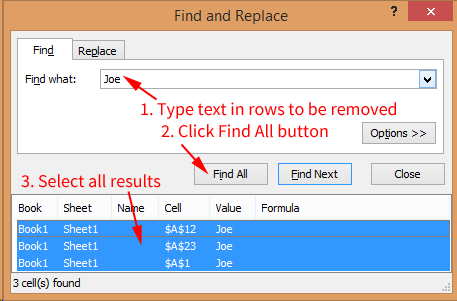
Recently I had some data from a website that was poorly formatted, but I needed to get it into a spreadsheet to work with. When I copied the data into the spreadsheet, I needed to remove all of the rows that contained certain irrelevant data, such as repeated header fields. Other use cases might require you to delete any rows containing someone's name, a location, or some … [Read more...]
How to Create Combination Charts in Excel
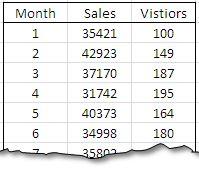
Most Excel users know how to create either a bar chart or a line chart to visually show a set of data. One way to really step up your game and graphically show multiple relationships across two or more sets of data is to use a combination chart. This powerful function will allow you to combine a bar chart and a line graph and add a Y-axis (vertical line) to express broader … [Read more...]