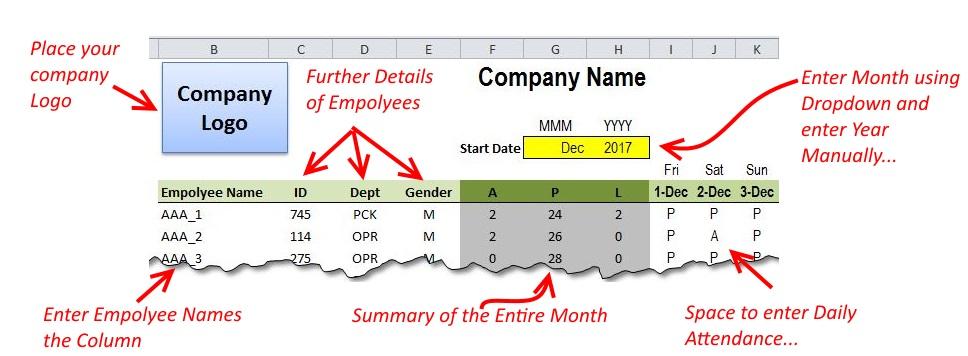
Managing attendance of staff is a very critical issue, be it a manufacturing firm or a service firm. There are several tools out in the market to manage this function. This ranges from the simple spreadsheets to ERP system that is very complicated and are extremely reliable. We at Excel zoom have produced a simple template to monitor the attendance of employees. This is a MS … [Read more...]
Creating a Waterfall Chart in Excel 2010
Water fall chart shows the cumulative effect of a quantity over time. It shows the addition and subtraction in a basic value over period of time and the final effect of these transactions. In Excel 2016, the chart is available by default and can be easily added through Insert>Chart>Other Charts>Waterfall. In today’s post, we will learn how to produce similar chart … [Read more...]
How to Use Excel to Keep Track of Personal Finances
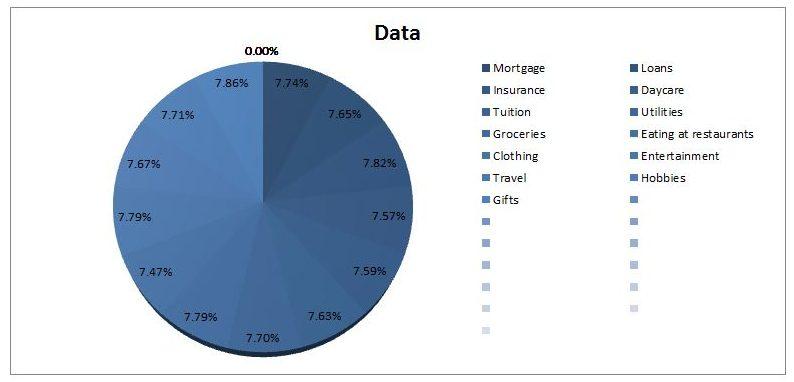
Keeping track of your personal finances can be a very painful exercise and prove very difficult to stay on top of. There are a number of online tools available to help in this regard but, more often than not, they aren't tailored to your financial profile or objectives. Using Excel to do this allows for simple customization to your needs without sacrificing the powerful … [Read more...]
Generating Random Data for your Excel Sheets
Whenever you have a formula or macro for a task, you would like it to be tested for some sample data. This sample could be real one – i.e. obtained from the historical record or you may test it with a some fake or random data. When it comes to testing formulas and macros, random data testing is a very common practice because it is not unusual that historical records may be … [Read more...]


