Introduction
COUNTIF () function constitutes a family of functions that is used for counting and specially for counting conditionally. We said that COUNTIF () is a family because there are few other similar function that are present in Excel that starts with COUNTIF.
These functions include COUNTIFS() that is used for counting more than one criteria, COUNTA () that is used to count the cells in a range that are not empty, COUNTBLANK () that is for counting blank cells and the function COUNT itself.
In today’s post we will explore the instances where these functions can be used. We will take up examples and understand which function best suits the situation and how that functions works to give the desired result.
An overview of COUNT family syntax:
Follow table gives the outline of the COUNT family functions:
Function | Syntax | |
| COUNT | =COUNT (value1,[value2],..) | Count no. of cells in a range that contains numbers. |
| COUNTA | =COUNTA (value1,[value2],..) | Count no. of cells in a range that are not empty |
| COUNTBLANK | =COUNTA (value1,[value2],..) | Count no. of cells in a range that are blank |
| COUNTIF | =COUNTIF (Range, Criteria) | Count no. of cells in a range that meets a specific requirement. |
| COUNTIFS | =COUNTIFS (CriteriaRange1, Criteria1,..) | Count no. of cells in a range that meets a set of requirement. |
If you look closely, the COUNTIF has become a special case of COUNTIFS() where criteria is set to one only. Let’s take-up few examples of how we can use COUNTIFS() function.
A simple COUNTIF() function:
Lets consider the following sample database, where we want to count the number of female student in a class:

We can use COUNTIF function to count the number of FEMALES in the data. The formula will be:

=COUNTIF(F2:F41,”F”)
Thus there are twenty three females in the said database.
Similarly we can try to find how many of them how many students in class 7 are in certain lass for example, the number can found with this formula:


Similarly we can find the number of students that are male and are in class 7 using the following formula:
=COUNTIFS(F2:F41,”M”,G2:G41,7)
..the answer is 8 – i.e. that is there are 8 male students in class 7.
Going one step further we can find the number of students that are male and are student of class 7 and 8 using the following formula:
=COUNTIFS(F2:F41,”M”,G2:G41,7)+COUNTIFS(F2:F41,”M”,G2:G41,8)
Note that in order to get an effect logical operator and, we need to add further COUNTIFS() and multiple criteria’s within COUNTIF() are of no use.
Another question that can be answered is the number of students born in a specific year – this can be calculated by using the date range in the COUNTIF() criteria:
=COUNTIFS(E2:E41,”>=1/1/1995″,E2:E41,”<=12/31/1995″)
To find the number of students born in a month, for example to find the number of Virgo (August 23 — September 22) could be a tricky one, but we can do it with the use of a helper column.


Another example of data-set:
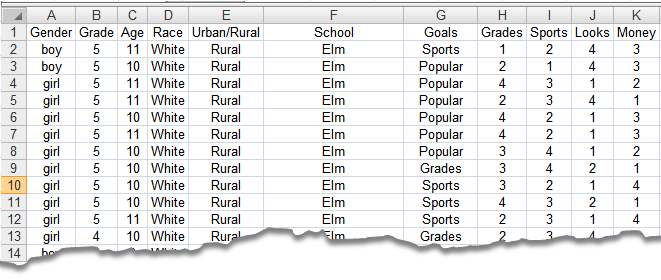
The following database named Popular Kid has been adopted from this source [Link]. The database surveyed 400+ students of various grades and school, and localities to found what they will choose to be at school from the following: making good grades, being good at sports or being popular at school. The factors were ranked from 1 to 4, one being most important and 4 being least important.


Let’s see how can we use COUNTIFS() to answer questions related to this survey
What was the response of grade 5 students about being good at grades in school?
The question asks us to find the response of grade 1 and being good at studies so we have two criteria fields – Grade in Column B and Grades in Column H. Since 1 represents least important and 4 being most important, we will use the following formula to answer the question:
=COUNTIFS($B2:$B479,5,H2:H479,1)
The answer is 39. So 39 students from grade 5 said that most important thing to them at school is to be good at grades. But this figure is not really meaning full if we don’t know what percent of student was 39. So we will improve our answer converting it to percentage.


Thus 12% of the student said grades are the most important thing to them.
Another important question could be this:
At what age the students started to consider good grades as the most important goal in their school lives.
The question can be answered by finding out the responses for all the age groups and for the case where student answered studies to be the most important goal. The following table will be produced when we use COUNTIF():


We can see that at the age of 11 years, most student found study to be their main goal.
Another interesting insight can be found if we examine the difference between the goals of the Rural and the suburban students by using COUNTIF. The following table will be produced.


The section of table that reports absolute values can be misleading, therefore we will discuss the table in terms of percentage – the right section. We can see that biggest section of suburban students prefer studies over any other goal (57%) whereas students from rural area find “Popularity” as the most appealing goal. It is interesting to note that none of the student is interested in “Looks”.
Conclusion:
There are numerous ways we can use COUNTIFS() as we see in second example we can get meaningful insight by correct usage of function. Please down load the file from this link and see how the examples actually work.