Introduction:
We have earlier discussed in our posts the essential excel skill that are required to a general spreadsheet user so he can be more productive in his workplace. Today, we will discuss the skills and tools that are of great benefit for accounts especially those into the audit business.
Our today’s post will cover the following area relating to “most wanted auditing excel skill” regarding:
- Formatting information in an audit report
- Presenting information obtained by auditors
- Analyzing the information obtained in an audit process
- Boosting productivity in an auditing activity
Excel Skill Set # 01 Formatting information obtained in an audit process:
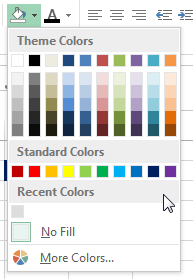
Color Filling a Cell:
This is one of the best possible excel skill – highlighting important information. Using a sharp color will automatically make the reader go that particular cell without going to unnecessary or less important information. This technique is even used when we are not using a pc and a spreadsheet software by using a Highlighter Pen. The shortcut key to access this feature is Alt+H+H. To un-fill use Alt+H+H+N.

Color Filling a Cell to Define Input, Formula Cells, and Helper Cells:
Color filling can be done to represent different areas and their purposes in our audit sheets. As a rule of thumb, Greige Filled Cells represent Formulas, Light Yellow Cells represent Input and so on. A user can develop his own “Key” to different cells fills to develop a model or audit sheet.
Using Borders on Cells:
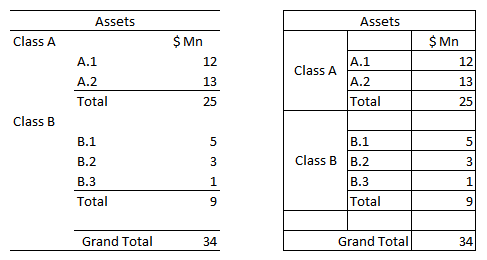
Borders a common feature related to cell and is frequently used in highlighting cells that are subtotals or totals hence a must have excel skill for auditors. Borders should be used with great care as adding too much borders will distract the attention of a reader off the important information. As a rule of thumb, avoid adding vertical borders to a cell. See following example of two information table with and without vertical borders.Obviously, the one on the right side in more readable. The indentation can be access by using the shortcut key combination: Alt + H + 5 and Alt + H + 6 for removing an adding indents respectively.
 Use Indentation to Mark Hierarchy in your data:
For longer sheets with numbers attached to every text entry, it is desirable to have hierarchy so that it is easier for user to understand break up of data. So in order to improve readability and data validation, add indents to your data so that it shows “Hierarchy” – look at the following example:

Obviously, the one on the right side in more readable.
The indentation can be access by using the shortcut key combination: Alt + H + 5 and Alt + H + 6 for removing an adding indents respectively.
Using Appropriate Number format:
Another valuable excel skill is to have proper format of dates, currencies and numbers with multitude of options in excel. The number formatting should be used appropriately to show desired formatting. Five handy shortcut keys for formatting numbers are:
- Number: Ctrl+Shift+~
- Time: Ctrl+Shift+@
- Date: Ctrl+Shift+#
- Dollar Amount: Ctrl+Shift+$
- Percentage: Ctrl+Shift+%
Excel Skill Set # 02 Presenting information by obtained in an audit:
Use Charts to Display for displaying information:
We can analyze trend in data with charts quite easily. It is the best tool to analyses large data sets and help reader in understanding data behavior.
- Time series data sets: Bar and Line charts are the best, besides bar chart, scatter charts can also be used to display data at any given interval say month, year, week or even on daily basis.
- Breakup of a Figure or Percent Contribution should be done by using Pi Charts.
- The Extent of Contribution or Impact level should be represented by using Radar Chart.
- For Plotting Variation in data, Use Line Chart or Scatter Chart.
As a rule of thumb or in order to make “great” charts:
- Avoid Vertical Lines in Graphs.
- Use Harmony of colors in charts.
- Always add a key or legend if plotting more than one variable.
Use Smart Art to Show Relationships and Processes:
Smart Art is a ready to use tool that allows user to show relationships, processes flow and hierarchies. Though we can make some manually but these ready to use “Stencils” are great from productivity point of view. We can use the shortcut key Alt + N followed by ZI + N to insert a Smart Art. This will lead you to following available options: Lists, Processes, Cycle, Hierarchy, Relationships, Pyramid, Picture, Office.com.
Use In-cell Charts or A Spark-line:
These charts are great when you have a lot of variables to be plotted. From Excel 2010, we have a newly added feature of in-cell charts. Earlier versions had to download a separate addin.
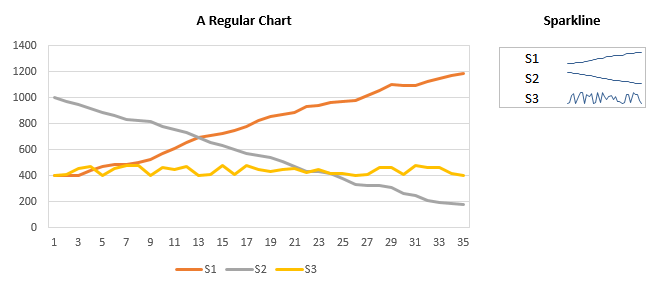
With built-in spark lines, we have option to plot simple line chart, bar chart and profit-loss bar chart. A comparison of how a regular chart plots three series against how Spark-line displays information is below:
This is ideal if you want to display the audit data as a dashboard (though this is a rare practice).
Excel Skill Set # 03 Analyzing the information from an Audit:
Use Pivot Tables:
These are the first and the best choice to start with when it comes to analyzing data. Just convert your data into a table and there you go. With pivot table, a user can create scenarios, drill down data, and increase or decrease level of details in the analysis and even can plot that data. We can update and append data in a pivot table by simply right clicking and refreshing. We can use Key Combination Alt+N+V to insert one.
Using Analysis Tool Pack:
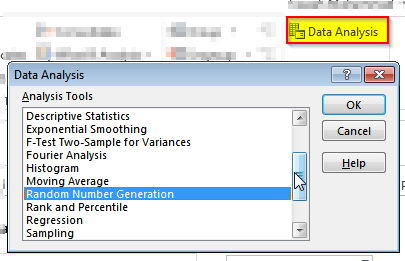
Analysis tool pack is an addin that provides pro-level data analysis tools like descriptive statics, various statistical tests, regression, histogram and more. If you are into a situation where you want to analyses data on statistical basis, this is your default solution.
Sometimes this addin not come pre-loaded. So a user need to go to Files Menu>Options>Add Ins> and select the addin to appear in Data Tab. Once added it will appear in the menu like below:
Using What-if Analysis Tool:
In order to create scenarios or do what-if analysis, this is available in excel. We can either use Scenario Manager, Goal Seek or Data Table using this options. The most versatile tool among these is the Scenario Manager. It practically allows you to build an entire model based on your own parameters and then analyze the situation. The tools is ideal in making the cash flow analysis for example in the audit process.

Excel Skill Set # 04 Boosting productivity in an auditing activity
There are so many add-ins available when it comes to excel that a user may easily get puzzled. However there are few out there in the market that are really productive and will help you standout at your work place:
Analysis Tool Pack:
We have already discussed this one earlier, it is great when analyzing data and comes along on statistical basis and is shipped with Excel by default. We need to activate it by going into options.
Addin from Ablebits.com:
This tools contains 60+ features that help you do more with your MS Excel. The addin will help you merging and consolidating sheets, consolidating data based on column headers, highlight duplicate rows etc. With this add-in, we can move, sort data, put water marks on sheets, create table of contents for them and has date and time picker for error free data entry. It also provides option to un-pivot a table, convert a table to multiple table based on column criteria and few more. In short, this is an excel add-in worth buying.
Auditing Toolbar by ExcelZoom.com
In order to mark information on your excel sheet relating to audit findings we have addin called the Excel Tickmark toolbar. The compact and precise interface holds a wealth of options that can help an auditors or accountants make the audit process quick and robust. The special symbols contained within the addin help auditors replicate the paper pencil process on the spreadsheet.

Out of the symbols present in the toolbar, it contains numbers, tick marks symbols with different colors, symbols to mark “verified”, “Agrees to GL”, “Prepared by Client”, “Agrees to PY”, “Agrees to TB”, alphabets: A, B, C, D and E, and small alphabets from a to i and few more symbols.
 Use Indentation to Mark Hierarchy in your data: