MS Excel’s interface has been designed to increase productivity and ease of use. Despite these beneficial features, there are requirements that are not always met by the existing features of excel. These requirements are fulfilled by using VBA as we write macros and add custom menus or we can write excel add-ins. An Excel Add-in a set of code designed to do specific tasks that are not necessarily present by default in excel.
Example of some an excel add-ins are Analysis Tool Pack and Solver Add-in. We will discuss excel add-ins that are very useful for day to day users of excel. Additionally, we will also be discussing the formula audit toolbar. This is a handy Audit tool for auditors and accountant, both professionals and students equally.
Excel Add-in from Ablebits.com
This is one of the best “Excel Add-in Suite” that is available against the price – the complete suite contains around 60 extremely useful features, that save your time and increases productivity. Some of the interesting features include merging and consolidating sheets and workbooks, consolidating data based on header columns and duplicate rows, creating vlookups and finding differences in similar sheets.


Besides this, we can remove duplicates and find unique entries, compare tables, do fuzzy match as well. The add-ins provides options to move, sort data , put water marks on sheets, create table of contents for them and has date and time picker for error free data entry. We can also un-pivot a table, convert a table to multiple table based on column criteria and few more. In short, this is an excel add-in worth buying.
Excel Add-in from ASAP.net
This is the second best in the market and is undoubtly one of the most used excel add-ins. This is a feature rich and user friendly excel add-in. The add-in has capability to format cells based on different situation or criteria, more options to dice and slice data, formatting text cases and cleaning extra spaces in cells like invisible space. We can sort sheets within a workbooks by shade and name, export sheets as separate files, protect multiple sheets at once and more. This excel add-in comes in two version, the free version is for home and domestic use while other one is for commercial use – for that we have to buy a license.

Audit Tickmark Toolbar by ExcelZoom
Accountants and Auditors are the main users of the Excel Audit Tickmark toolbar. The toolbar comes with a simple but effective interface. The excel add-in contains symbols and signs that are commonly used by auditors or accountants in their daily work. These not only give the spreadsheets a polished and professional look but also provide valuable functionality and standardization for larger teams. This notation practice helps make appropriate notes and makes it easier for others to follow the instructions.
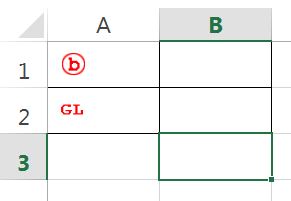
The symbols included in the toolbar are Numerals from 1 to 9 and four different versions of tick marks. The toolbar also includes a set of symbols that are purely related to audit professionals. Besides these, it includes symbols to mark “verified”, “Agrees to GL”, “Prepared by Client”, “Agrees to PY”, “Agrees to TB”, alphabets: A, B, C, D and E, and small alphabets from a to i and few more symbols.
We enlarge the inserted symbols in the cell, besides inserting symbols can also be scaled-up in size. Further, we can also insert more than one tick in a cell which is particularly useful for first and second reviewer practices. Comments can be inserted directly from this add-in into a cell.
Following is the add-in tab:

We can insert symbols like below on activating this excel add-in:

Peltier Tech chart utility Excel Add-in
If we need to create different sorts of custom charts then this is a tool for ours. Comes for excel 2010 to 2016 and contains 8 to 22 custom charts. The add-ins makes creation and editing of charts a breeze.
For example, we can produce waterfall charts, box plot, cascade charts, histograms, pareto charts and cycle plot. In actual version of excel, either these charts require a lot of extra efforts and user to be an export of excel formulas and charting techniques, but this add-ins makes it really easy for a novice.

With this add-in , we can edit Series formula, add and edit label last point, add a new series, do LOESS regression and quadratic loess registration, edit pivot styles and others.
XY Chart Labeler
As the name describes, the add-in is used to label charts. in cases without this case add-in, we have to select individual points in a charge and then have to edit its label text and formatting. This add-in provides an intuitive interface to do this tedious task.
The feature includes addition of labels based on cell range, thus you can edit cells rather then selecting labels individually, this is also intuitive as cells may contain formula results from other cells and we can have a dynamic label using this feature.

The data labels can also be moved using this add-in in any direction or at a certain distance. The add-in also provides an option to manually label the data sets in cases where we want to edit just a single point in the dataset or the last option is to delete the label at all.
It might appear that we can have all these functionalities done with default versions of a chart, but for larger data or for charts with lot of label formatting, this is a god send.
Unviewable +:
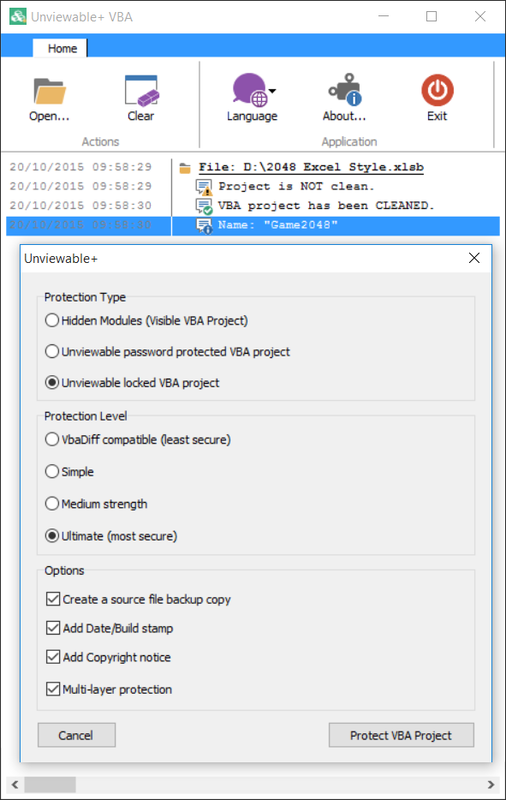
A workdsheet’s vba code can be protected using this add-ins. This is a great tool for developers and excels geeks that want their code to be protected. The add-in uses a simple interface that seeks information regarding what is to be protected within your vba project.

It offers three different Protection types: Hidden Modules, Unviewable password protected VBA Project and Unviewable locked VBA project. Similarly Protection level can vary from least secures to medium and most secure level to safeguard your code. There are further options available to create a backup file, add date and build stamp, add a copy right notice and activate multi layer protection. The result is a password protected vba content of a workbook, while message being displayed for the status.
The waterfall chart creator:
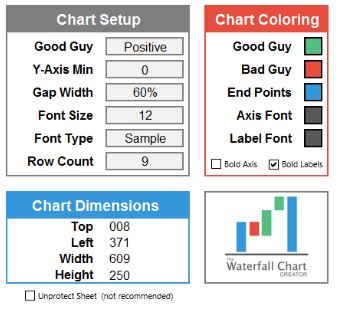
Waterfall chart is amongst very commonly used charts in excel, but though usual and common, setting it up is a tedious task. This tedious task is made easy by using this dedicated add-in that is meant to produce waterfall chart only.

The add-in comes in with chart coloring options, for different and end of the year series, for formatting axis fonts and for label fonts as well. We can also set the dimensions of charts like width, height, top and left.

Unlike manual charts, we need just three columns to create waterfall chart with this add-in. There is an option to export charts to new workbooks and to add as many charts as you like!
The Ribbon Commander:
This is a very useful add-in when it comes to modify the ribbon interface of excel. It allows the ribbon interface to by dynamic i.e. changeable. This add-in allows developers to modify the interface as per their requirement and also allows end users to change it.
With ribbon command, developers have access to the full object model of MS Excel (indeed complete MS Office) for Office 2007 and later versions. It fully supports VBA, and besides VBA, .Net and COM development languages like VB6 and VC. Further it is 100% compatible with existing Office XML codes!
Conclusion:
This post does not cover every Excel Add-in available on internet. For example this post does not cover excel add-in for specific fields like Operations Management, and Operations Research. Also Statistics or Numerical Methods related excel add-ins are not covered. They have their specific audience and a specialized used. For General Audience and for day to day use of Excel however, above add-ins are must have for an excel user.
Know of some great time-saving Excel add-ins or toolbars? Please let us know your favorites in the comments so everyone can benefit.