Solver is an add-in tool that lets you find solutions to various problems. You can use solver in Excel to run through “what-if” scenarios that might help you determine the best course of action. The “best” answer will be different for each problem, and might include maximizing profits, reducing cost, or producing the best use of resources.
Before we continue, you should check to see that Solver is installed on your version of Excel.
Navigate to the add-ins menu, and make sure that Solver Add-in has a check in the box next to it.
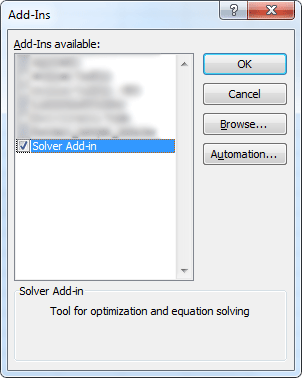
You should then be able to find Solver in the Data tab.

If you’re able to see Solver in the Data tab like in the screenshot above, you should be all set to use Solver in Excel.
To understand how to use Solver in Excel, you should know the group of cells that the add-in works with:
- Decision Variable Cells: The values in the variable cells are adjusted by Solver when solving a problem.
- Constraint Cell: Provides Solver with the restrictions, or limits on the values that it has to work with in order to produce a result.
- Objective Cell: Solver provides the optimal value depending on the criteria provided in the Objective Cell. This cell must contain a formula.
Before you start to use Solver, you will want to have a spreadsheet set up with a problem that you want to solve. For demonstration purposes we will work with a spreadsheet that is trying to determine how many of four different types of “Widgets” to manufacture in order to maximize profits.
We will assume that each Widget produces the following profits:
- Widget A: $25
- Widget B: $35
- Widget C: $45
- Widget D: $55
Assuming there were no constraints, and we could manufacture and sell Widget D just as easily as the other Widgets, we should drop Widgets A-C and just focus on Widget D.
However in real life there are constraints such as time to produce, availability of materials, etc.
Let’s also assume the following constraints for each Widget:
- Widget A Requires:
- Part A: 4
- Part B: 6
- Time (hours): 0.25 (15 minutes)
- Widget B Requires:
- Part A: 6
- Part B: 5
- Time (hours): 0.25 (15 minutes)
- Widget C Requires:
- Part A: 4
- Part B: 8
- Time (hours): 0.5 (30 minutes)
- Widget D Requires:
- Part A: 6
- Part B: 10
- Time (hours): 0.5 (30 minutes)
We also have a maximum of 17,000 Part A, 50,000 Part B, and 2,000 hours of labor.
What we are looking to do is solve the following equation, where YA is the quantity of Widget A, YB is the quantity of Widget B, and so on.
Maximize: 25 YA + 35 YB + 45 YC + 55 YD
Subject to these constraints:
Part A: 4 YA + 6 YB + 4 YC + 6 YD <= 17,000
Part B: 6 YA + 5 YB + 8 YC + 10 YD <= 50,000
Time: 0.25 YA + 0.25 YB + 0.5 YC + 0.5 YD <= 2,000
Additionally, another constraint is you can’t build a negative number of any of the Widgets, so:
YA + YB + YC + YD >= 0
Set-up Your Spreadsheet With Data
We can then build a spreadsheet with this information:
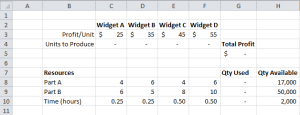
In the spreadsheet all the numbers, other than the numbers in column G, were manually entered. There are four cells with formulas:
- G5: =SUMPRODUCT(C3:F3,C4:F4) – Note this is the same as saying =C3*C4+D3*D4+E3*E4+F3*F4.
- G8: =SUMPRODUCT(C8:F8:$C$4:$F$4) – In this formula, we add the $ signs to keep the reference to cells C4:F4 static when we eventually copy the formula to other cells.
- G9-G10: Copy the formula from G8 down to G9 and G10. Since we used the $ signs in the formula in G8, the formula in G9 and G10 will retain the references to cells C4:F4 (because this part had the $ signs), but will update itself to reference C9:F9, and C10:F10 (since this part did not have $ signs).
Use Solver to Maximize Profits:
Now, to find out the maximum profit, we are going to let Solver run through the scenario and provide us with an answer. First we need to tell Solver what we are trying to do.
- On the Data tab, click on Solver.
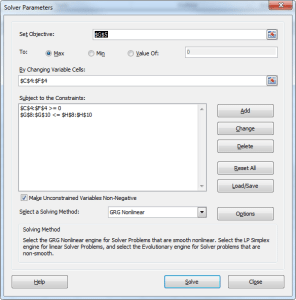
- Click in the Set Objective field and type $G$5, or click on cell G5. This tells Solver which cell we want to optimize.
- The To option should be set to Max. This tells Solver that we want to maximize the value in cell G5.
- In the By Changing Variable Cells box, type $C$4:$F$4, or highlight the range C4:F4 with your mouse. This tells Solver which cells should change in order to maximize the value in cell G5.
- Next to the Subject to Constraints box click the Add button. Here we will provide the constraints that we described in the math formula above.
- We want the resources to be limited by the quantities we have available, so in the Cell Reference box (left side), enter $G$8:$G$10, or select the range G8:G10 with your mouse.
- The dropdown box (middle) should be set to <=.
- The Constraint box (right side) should be set to the maximum quantities available, which in our case is $H$8:$H$10.
- Click OK.
- If we had additional constraints to enter, we could do so by clicking the Add button. In this case we want to make sure the Units to produce are not negative, we could enter a new constraint of $C$4:$F$4 >= 0.
- Since all of our variables are constrained, it won’t change the outcome if you check or uncheck the box for Make Unconstrained Variables Non-Negative.
- Click Solve.
Solver will run through the problem and provide the optimal number of each Widget type to produce in order to maximize profits. You should see a message saying that “Solver found a solution”.
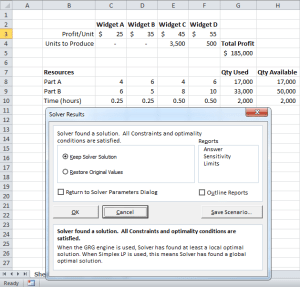
In this scenario, in order to maximize profits we need to produce 3,500 of Widget C, 500 of Widget D, and none of Widgets A or B.
Find Ways to Further Maximize Profits:
If we want to generate an Answer report, click on Answer under the Reports section in the Solver Results window. Solver will create an Answer Report tab to the left of the tab you are working on.
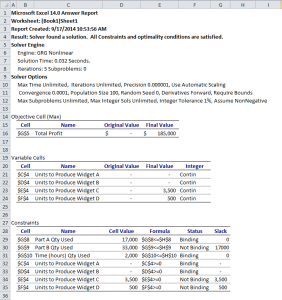
The Answer Report will show you the original and final values of the objective and variable cells. It will also list out the resources that prevented Solver from further maximizing our profits.
In this case, Part A and Time were both fully used up. In the report their status is “Binding”, with a slack of 0. Part B was the only resource that was not binding, as there were 17,000 units left over.
In the real world we could use this information to try to determine if we could possibly acquire more of Part A, and hire more employees to further maximize the profits.
If this wasn’t a possibility, we could see if there was something else we could make with the 17,000 remaining units of Part B.
Other Ways to Use Solver in Excel:
We just ran through a simple scenario to maximize the profit of a widget manufacturer. However the usage of Solver is not limited to producing widgets.
You can use Solver in Excel to help allocate money to certain investments, purchasing real-estate, or scheduling staff at a multi-location business.
Do you use Solver in Excel? Let’s hear about how you use it in the comments.