Introduction
There are two ways of organizing your data in Excel, either it could be a list or it could be a excel table. Both has its advantages and disadvantages. In today’s post, we will try to learn about the later and see how to get most out of it – i.e. excel tables.
Tables are identified by a header row and a column, where is for list, there is only a header row. Tables are good when you want to summarize the information. The conventional table can be created by simply putting borderline around the data, but for a table to be an excel table, you need to apply the table formatting to it using the ribbon menu or simply press CTRL+T as you have selected the data.

You can apply formatting according to your choice of color. This is the table produced by applying table formatting.

Using options in Table Design Ribbon:
There are number of options available to format layout of the table. Here are they listed with some explanation.
Header Row:
This will add the header row for the table. For our case it is months listed in the Row # 3.
Banded Rows:
Enabling this option will show the horizontal border lines in the table cells.
Banded Columns:
Enabling this option will show the vertical border lines in the table cells.
Total Row:
This will automatically add a total row to the bottom of the table – if you have added the total column then it will be added to the total column. More on this in later section of articles.
First Column:
This option will turn First column Text bold.
Last Column:
This option will turn Last column Text bold.
Other Options Available:
The Excel table can be exported to SharePoint and the data can be refreshed from the option given. We can also refresh the range of the table in we have put more rows or columns in it and also there is an option to remove duplicates from the table.
Adding Subtotals to the Last Row:
Adding subtotals to the last row is easy – you can go to table design menu, select add total row and it’s done. By default, it is added to the last column to the right if you have added the total column. But it could be added to any column in the table.
The last row can display variety of functions beside the default SUM function. We can have average, max, min and count functions as well for our tables.

There is even an option to get more functions for the table, just click more functions to access all the functions.
Consolidating data present in Tables:
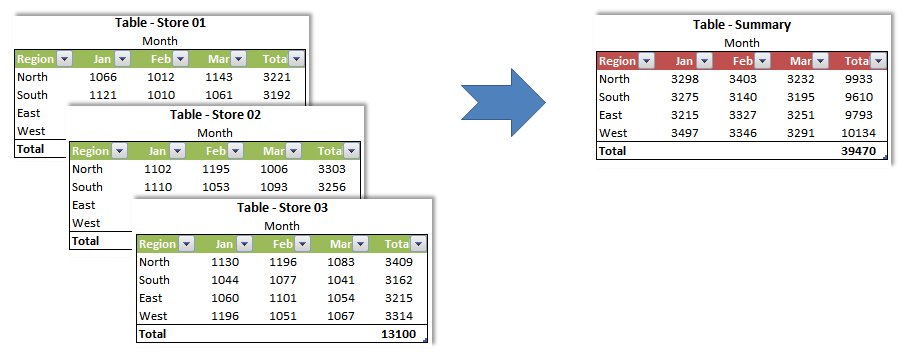
This will work even if the data is not present in tables, but works a treat if it is an excel table, as you have already that subtotal function added to you data. In order for consolidation option to work, you need to have multiple table of similar format on different sheets. Just as shown in the following diagram:

The process starts by laying down three similar tables, and a similar table for summary. Then we point to the ribbon and go to tab “Data” and select he consolidates option. A menu pops up asking for few following options:
Function to be used:
This option lists down what type of function would you like to use – there are around a dozen of functions available like: Sum, Count, Average, Min, Max, Product and so on. We can use these functions as per our requirement.
Further Advantages of Using Tables:
With using data tables, it becomes really easy to enter data as the table keeps expanding as we enter data. This is done with the help of a small blue box that appears in the last row of the table. As reach the cell with this box and press Enter, a new row is automatically added the.
- There is no need to drag down the formulas or flash fill formulas, the formulas in excel table is automatically filled. We just need to enter on the top row and the rest of the column is filled automatically.
- There is no need for freezing panes when working with a table. With non-excel tables, we need to freeze pans so that when we scroll, we can see the header row, but with excel tables the header row is always visible.
- You don’t need to the total row, as already described in the previous sections. Infect you can use anything besides sum to summarize the sheet.
- There is a lot of ease in creating charts. If you are making tables the basis of the chart, the data in the chart will be updated automatically and there is no need for manually dragging ranges.
Conclusion:
Tables are handy features of MS Excel. They are useful because they allow better management of data, easy calculations and stigmatization. Please download the file from this link and see how it actually works.