Accountants are part of every organization, and they are important because they manage the monetary aspects of the business. They must be able to work with different types of people and across various departments. Therefore, they must use various tools, one of which is MS Excel. In order to use it productively, they must have the necessary skills and know when to apply them.
In this short post, we will learn the five key excel skills that are needed for accountants. Essentially these are the five features of the program that every accountant should know. We will go through each of them one by one and you will see how it leads to improved efficiency and productivity in your everyday work.
Understanding and Using Formulas:
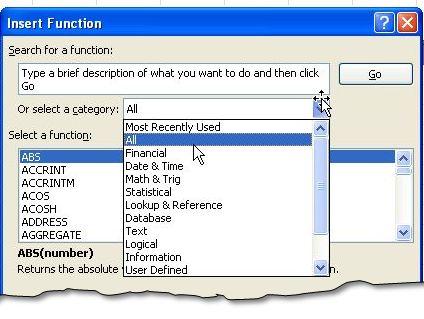
Excel 2010 has functions that are present under various categories. It is not correct to say that an accountant should learn each and every function in Excel. For example we will not find it convincing that an accountant should learn “Engineering Functions”. Learning a few of them that are regularly used can help automate tasks.
Excel’s built in formulas come with help and examples so they are really easy to understand. In fact they are great help in preparing templates (for example Managing attendance with Excel zoom’s Attendance Template) for performing repeating calculations. Accountants will find functions related to Date and Time, Finance, Math and Trigonometry. Additionally, Statistical, Lookup and Reference functions are used quite frequently.

MS excel also offers option to create user defined functions through VBA (Visual Basic). With VBA, created function can be called and used in the workbooks like a built in function. So if you find something missing from Excel, just write a VBA function for that or, better yet, create an Excel Add-In similar to our Excel Audit Tick Mark Toolbar.
Managing Data with Tables:
Tables helpful in managing data in your worksheet and yet another great Feature of MS Excel. Learning how to use a Table can be a really helpful skill for accountants. Table provides us some key features that make slicing and dicing data easy. For example with tables, filtering table becomes a breeze. Similarly, we have automatic subtotal in the footer row. We can format it the way we want and choose color schemes from the template.
The real benefit of Tables becomes evident when it comes to write formulas. With tables, we don’t to update ranges in the formulas. They are automatically updated with new data being entered. Another benefit when we are using tables is that Table formatting is automatically applied to new data appended to the table.

Data once sorted in table can have subtotal added to them. This is in addition to the row and column that we insert from the Table Tab. So learn how to use Table and you will improve your efficiency a lot.
Manipulating data with Pivot Tables and Power Pivot:
If an accountant is not able drill down its data to a meaningful level, he can certainly do it with Pivot Tables. Pivot Table is tool that is used to create instant summaries from Lists as data source. While using Pivots, you can slice the data by dropping field to there area within the pivot table. Then filtering the data for details that you want will give the desired report. You can add totals, and customize the how different fields are calculated.

In Excel 2010, a new feature with the name of Power Pivot is provided that has to be installed separately. This comes loaded with a lot of new feature to the parent Pivot Tables (lately becomes part of it installation). As the MS website describes “you to import millions of rows of data from multiple data sources into a single Excel workbook, create relationships between heterogeneous data, create calculated columns and measures using formulas, build PivotTables and Pivot Charts, and then further analyze the data”
Presenting with Charts:
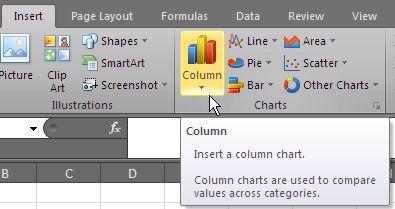
Business presentations are incomplete without Charts. They are the visual presentation of data that makes understanding and decision making easier. Excel has various types of charts that can be used to suit the requirement – but most commonly used are bar and line charts that every accountant must know how to do. These charts plot variables over the time (most of the time) or variables over some categories.

Anther type of chart that is useful for accountant is Pie chart that shows contribution of various factors to make a pie. This can be used to show various factors that contribute to a factor. You can also combine charts (not all but few) format them your taste. You can also export these charts to Power Point that will make your presentation more professional.
Analyzing with Analysis Tool Pack and What-If Analysis Feature:
This is a feature that comes when you install the analysis tool pack add in and is one of the most liked features by people who are into the data analysis field and are using Excel for it. Since accountants need to deal with data, they need to be good at statistics and how use and /or at least interpret the results form it.

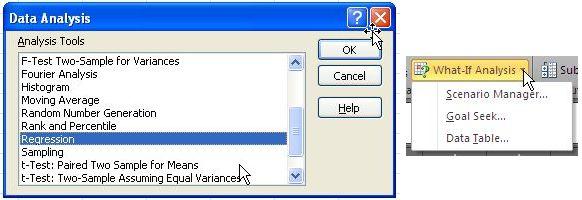
Analysis tool pack equips Excel with various analysis tools, for most the “Regression Analysis” that is used to develop relation between two variables. It can be used for analyzing impact of one variable over other and can be use to predict values based on some input values. Similarly, one can have descriptive statistics for the data and can generate random numbers for use. It can create histogram for you as well.
Besides analysis tool pack, What-If analysis feature can help you create and analyze scenarios. It comes with Goal Seek, Data Tables and Scenario manager – each one directed helps you analyze the possible options and their impact on other variables.
Conclusion:
This is not the end of excel skills neither the end of excel skills the list that an accountant should learn. These are just few features of excel that help an accountant improve its efficiency, make analysis more real-time and make using excel fun. With every new edition of Excel, MS is adding new features to improve excel. The best approach will be to learn what is needed for you!